Sentinel-2
Overview
SENTINEL-2 is a European wide-swath, high-resolution, multi-spectral imaging mission. Its high-resolution optical images have many applications, including land monitoring, emergency response and security services assistance. The satellite’s multispectral imager provides a versatile set spectral bands spanning from the visible and near infrared to the shortwave infrared.
The full mission specification of the twin satellites flying in the same orbit but phased at 180°, is designed to give a high revisit frequency of 5 days at the Equator.
SENTINEL-2 carries an optical instrument payload that samples 13 spectral bands: four bands at 10 m, six bands at 20 m and three bands at 60 m spatial resolution. The orbital swath width is 290 km.
Application
- Land cover/land use classification
- Change detection
- Precision agriculture and monitoring of agricultural land
- Forestry and natural resources
- Land surface phenology and monitoring of phenology stages
- Contribution to Essential Climate Variables (ECV) monitoring
- Coastal zones and inland water
- Data assimilation in dynamic process models
- Data fusion
- Cloud detection and atmospheric correction
Bands Description
| Name | Scale | Spatial Resolution | Wavelength | Description | |
|---|---|---|---|---|---|
| B1 | 0.0001 | 60 meters | 443.9nm (S2A) / 442.3nm (S2B) | Aerosols | |
| B2 | 0.0001 | 10 meters | 496.6nm (S2A) / 492.1nm (S2B) | Blue | |
| B3 | 0.0001 | 10 meters | 560nm (S2A) / 559nm (S2B) | Green | |
| B4 | 0.0001 | 10 meters | 664.5nm (S2A) / 665nm (S2B) | Red | |
| B5 | 0.0001 | 20 meters | 703.9nm (S2A) / 703.8nm (S2B) | Red Edge 1 | |
| B6 | 0.0001 | 20 meters | 740.2nm (S2A) / 739.1nm (S2B) | Red Edge 2 | |
| B7 | 0.0001 | 20 meters | 782.5nm (S2A) / 779.7nm (S2B) | Red Edge 3 | |
| B8 | 0.0001 | 10 meters | 835.1nm (S2A) / 833nm (S2B) | NIR | |
| B8A | 0.0001 | 20 meters | 864.8nm (S2A) / 864nm (S2B) | Red Edge 4 | |
| B9 | 0.0001 | 60 meters | 945nm (S2A) / 943.2nm (S2B) | Water vapor | |
| B10 | 0.0001 | 60 meters | 1373.5nm (S2A) / 1376.9nm (S2B) | Cirrus | |
| B11 | 0.0001 | 20 meters | 1613.7nm (S2A) / 1610.4nm (S2B) | SWIR 1 | |
| B12 | 0.0001 | 20 meters | 2202.4nm (S2A) / 2185.7nm (S2B) | SWIR 2 | |
| QA10 | 10 meters | Always empty | |||
| QA20 | 20 meters | Always empty | |||
| QA60 | 60 meters | Cloud mask |
Temporal availability
November 2015 - ongoing
Revisit time
5 days with two satellites
Spatial coverage
Land and coastal areas between latitudes 56°S and 83°N
Data Product
SENTINEL-2 products available for Users are listed in the product types tables.
| Type | Description | Users | Production & Distribution |
|---|---|---|---|
| Level-1B | Top-Of-Atmosphere radiances in sensor geometry | Expert Users | Systematic generation and online distribution |
| Level-1C | Top-of-atmosphere reflectances in cartographic geometry | All Users | Systematic generation and online distribution |
| Level-2A | Atmospherically corrected Surface Reflectances in cartographic geometry | All Users | Systematic generation and online distribution |
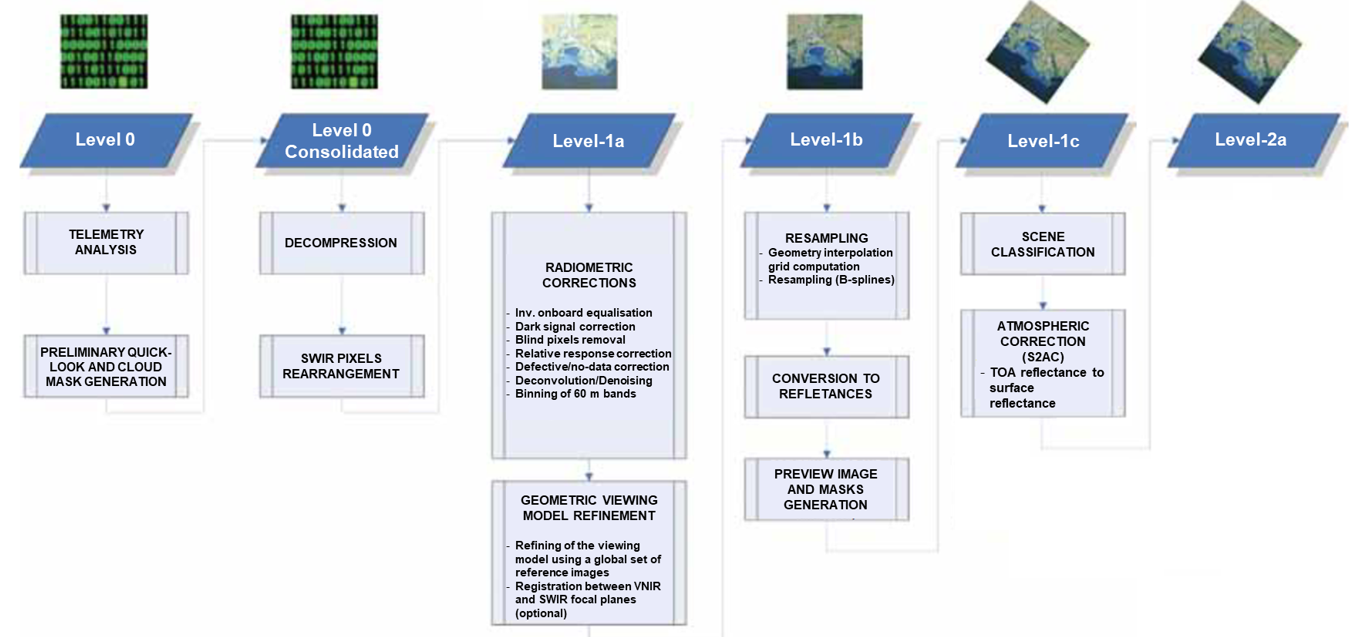
Only the Level-1C and Level-2A products are released to Users.
Sentinel Band Combinations
We use band combinations to better understand the features in imagery. The way we do this is by rearranging the available channels in creative ways.
By using band combinations, we can extract specific information from an image. For example, there are band combinations that highlight geologic, agricultural, or vegetation features in an image.
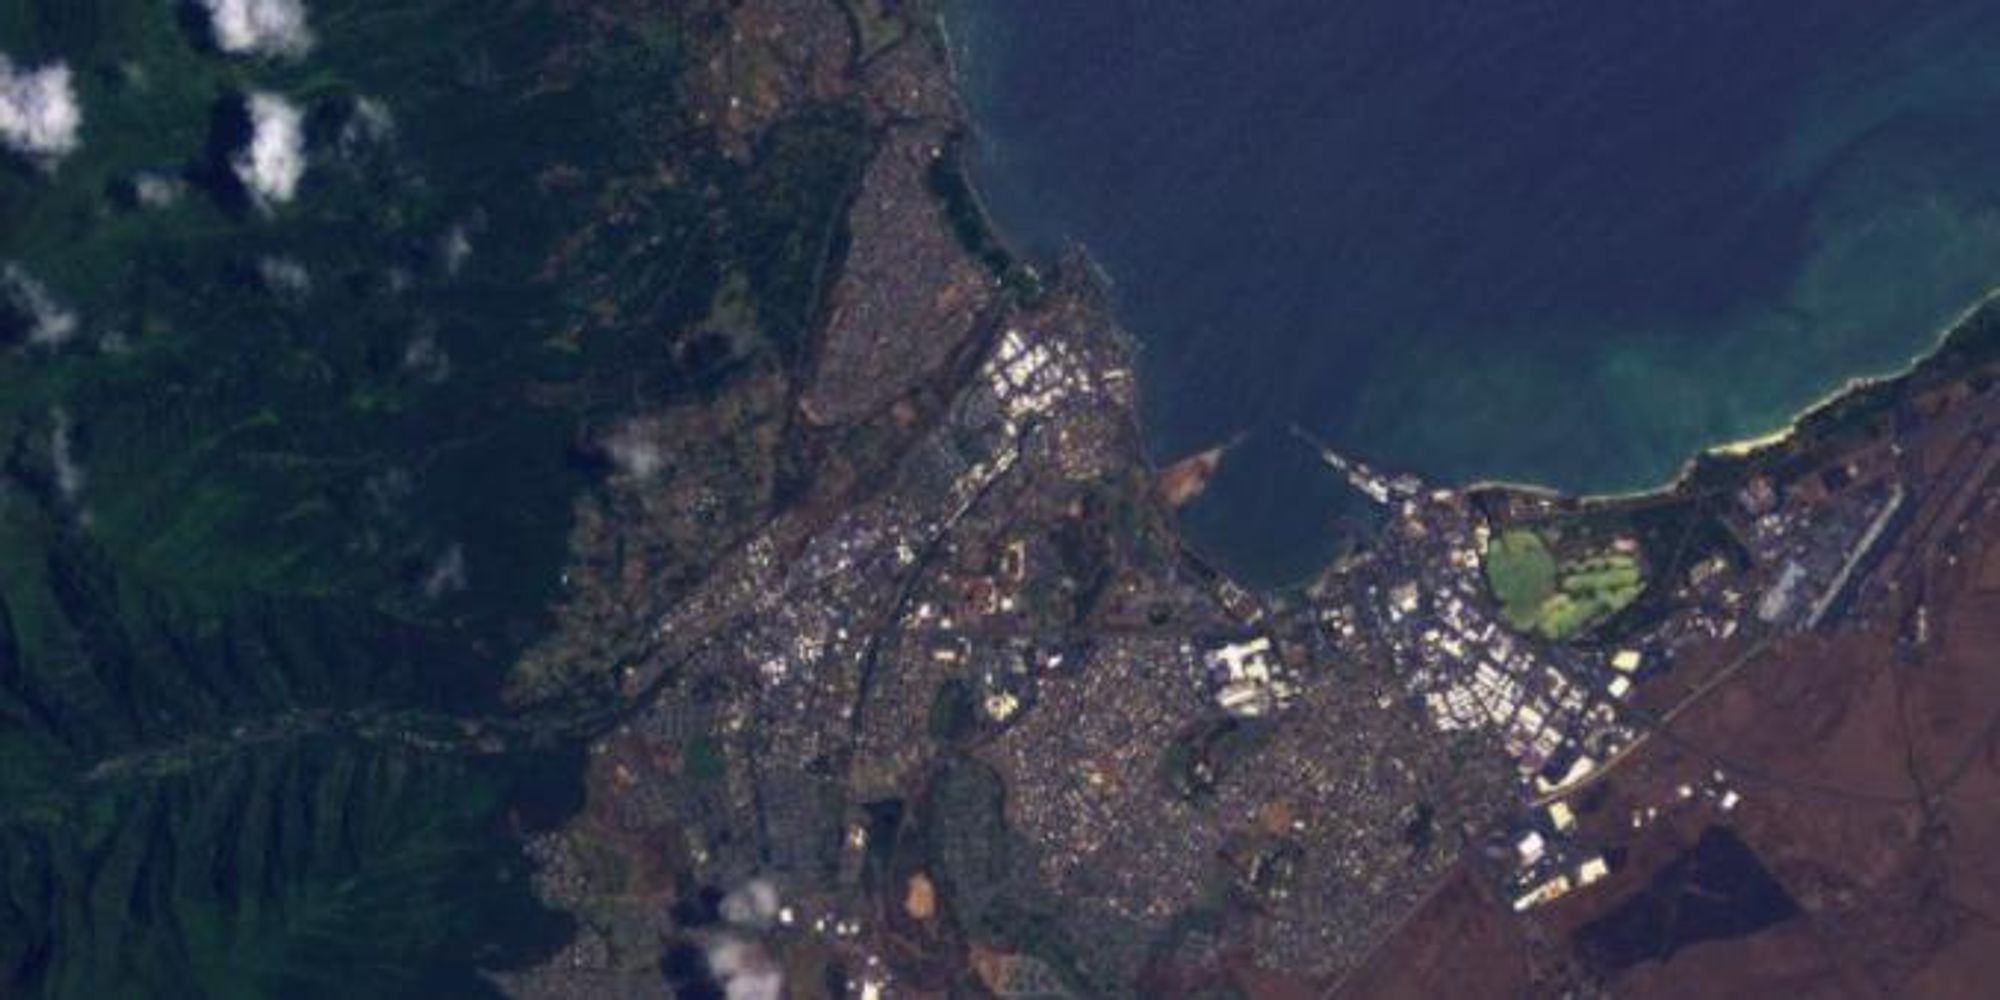
Natural Color (B4, B3, B2)
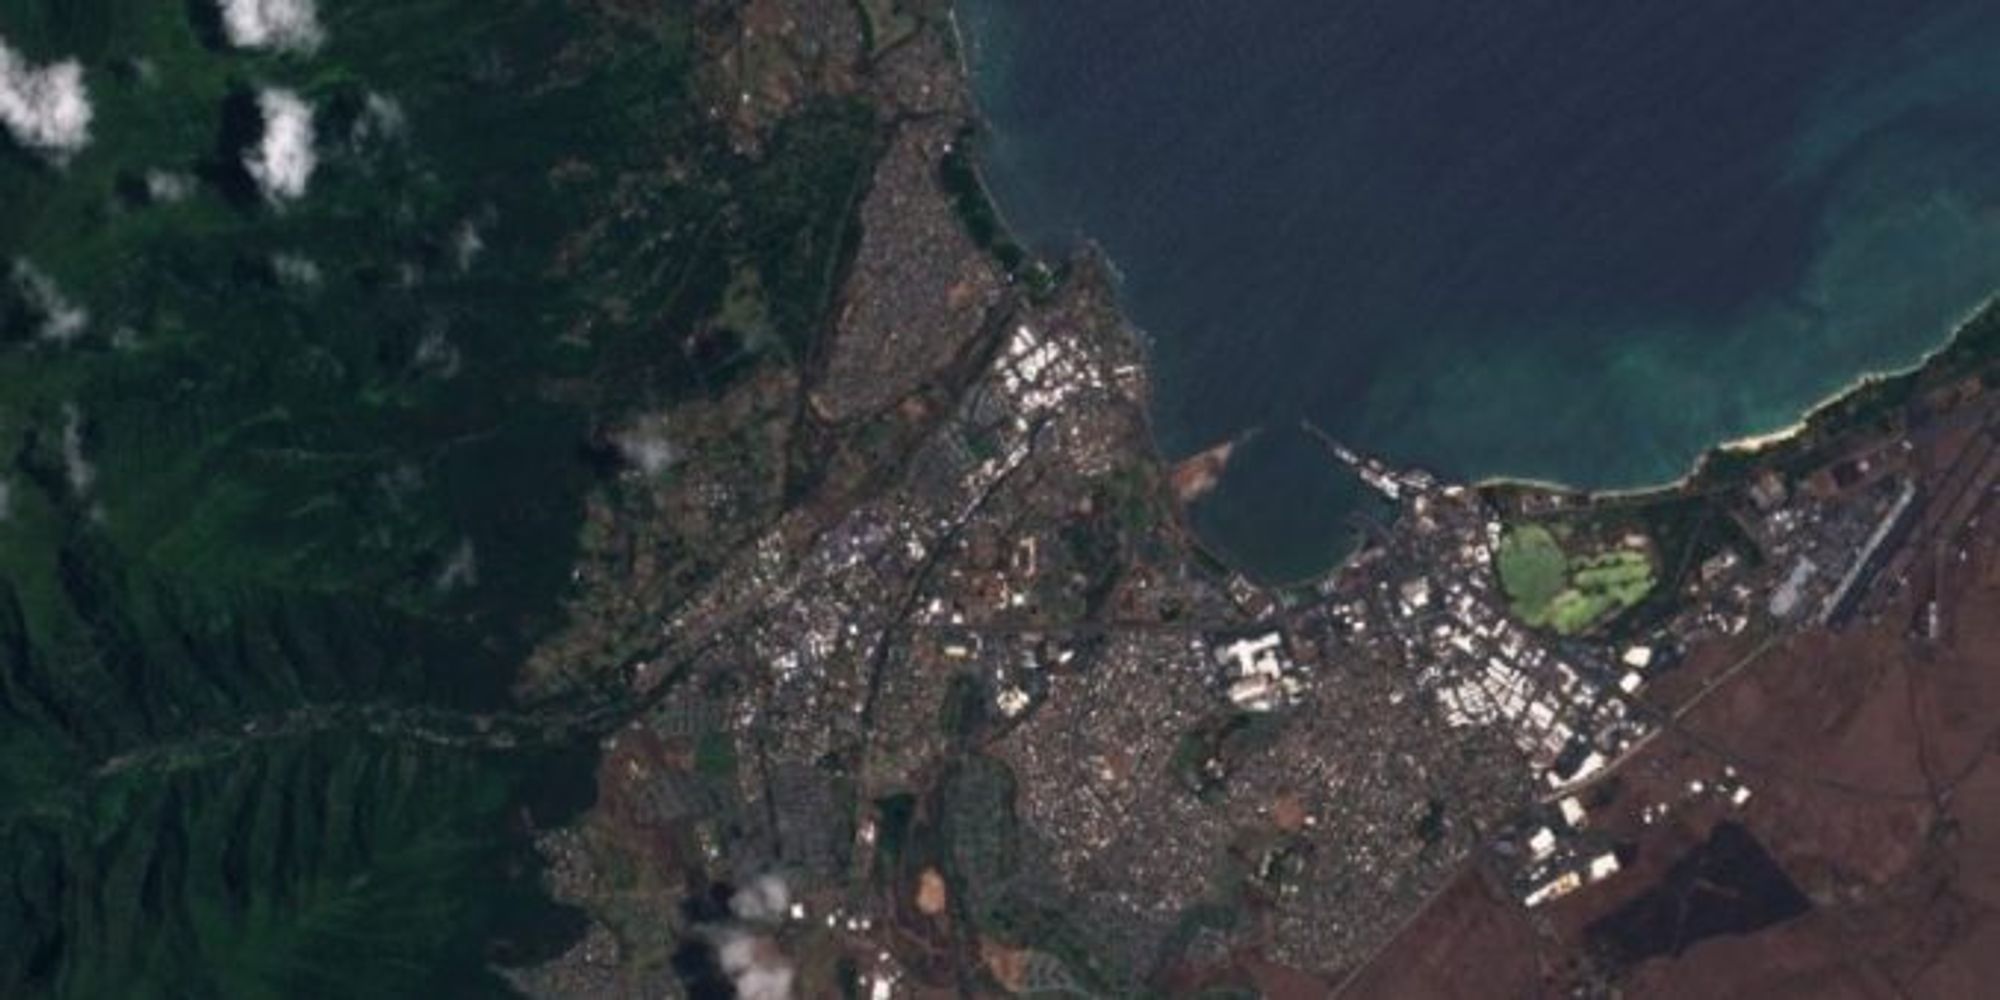 The natural color band combination uses the red (B4), green (B3), and blue (B2) channels. Its purpose is to display imagery the same way our eyes see the world. Just like how we see, healthy vegetation is green. Next, urban features often appear white and grey. Finally, water is a shade of dark blue depending on how clean it is.
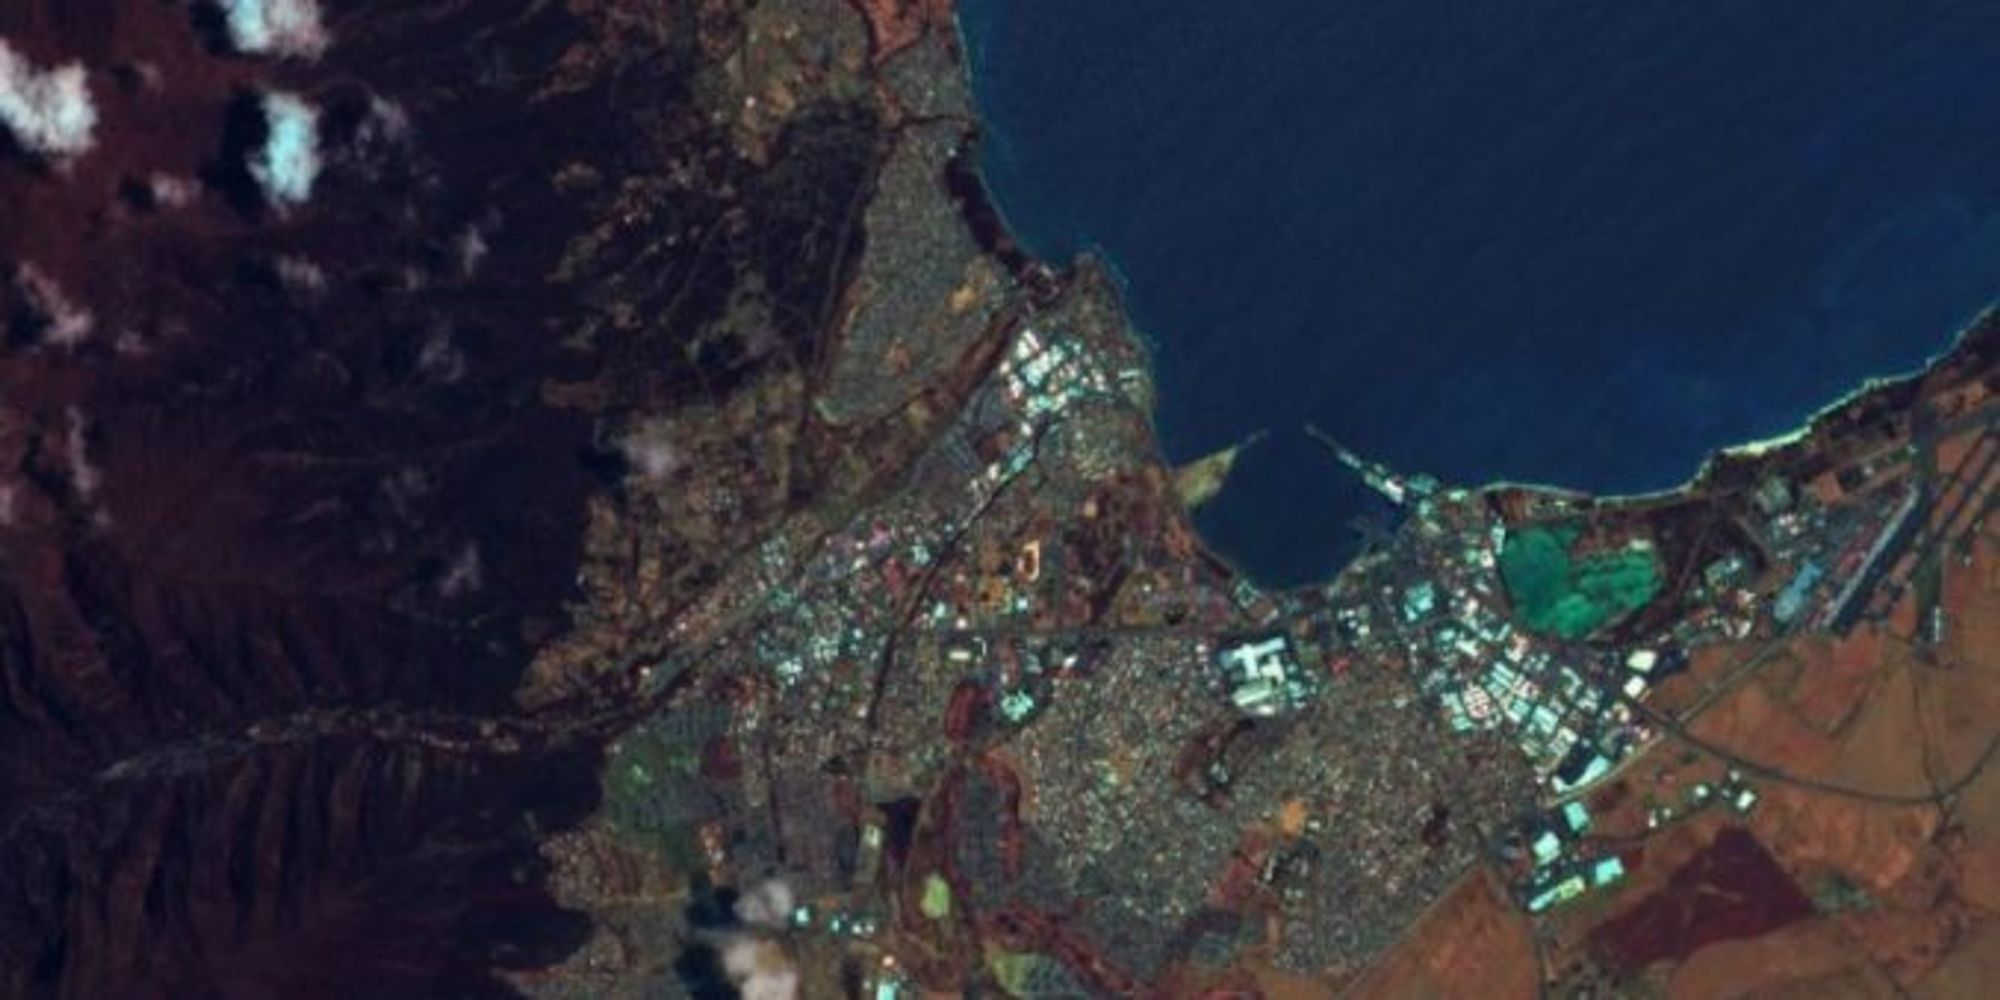
Color Infrared (B8, B4, B3)
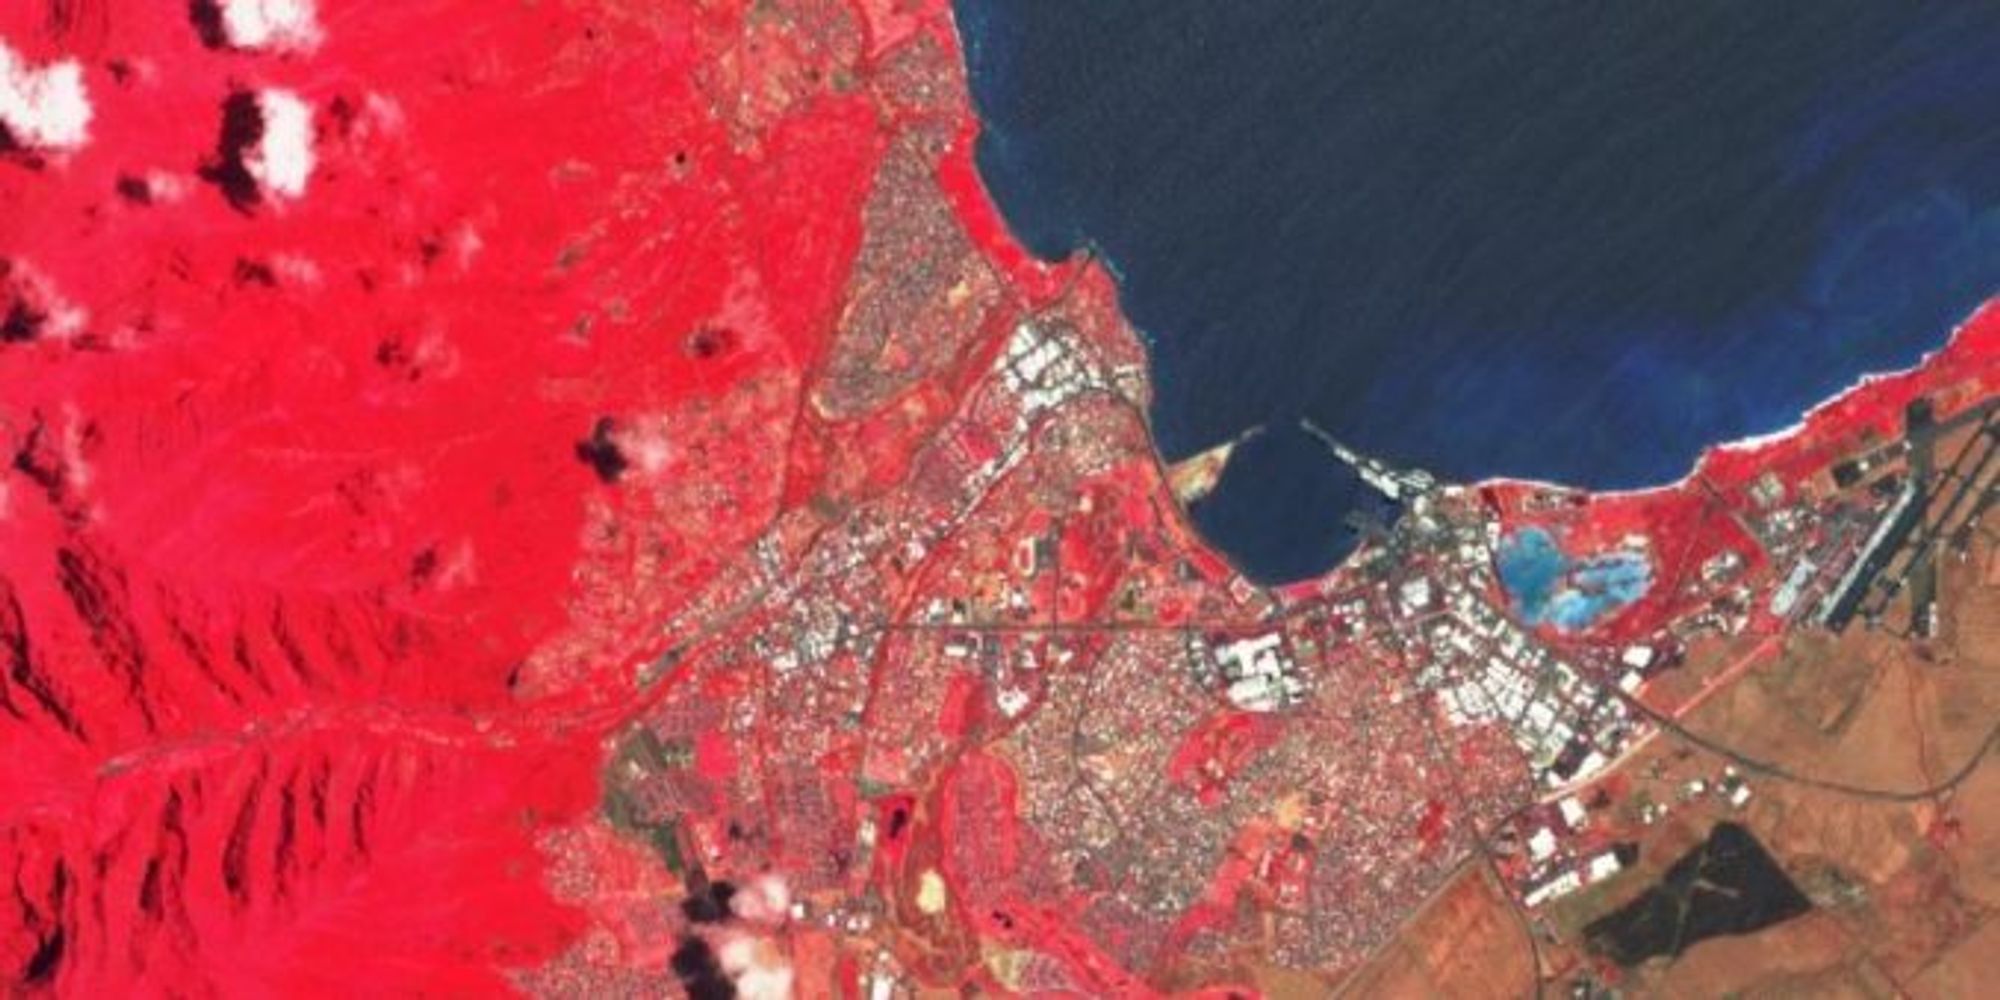 The color infrared band combination is meant to emphasize healthy and unhealthy vegetation. By using the near-infrared (B8) band, it’s especially good at reflecting chlorophyll. This is why in a color infrared image, denser vegetation is red. But urban areas are white.
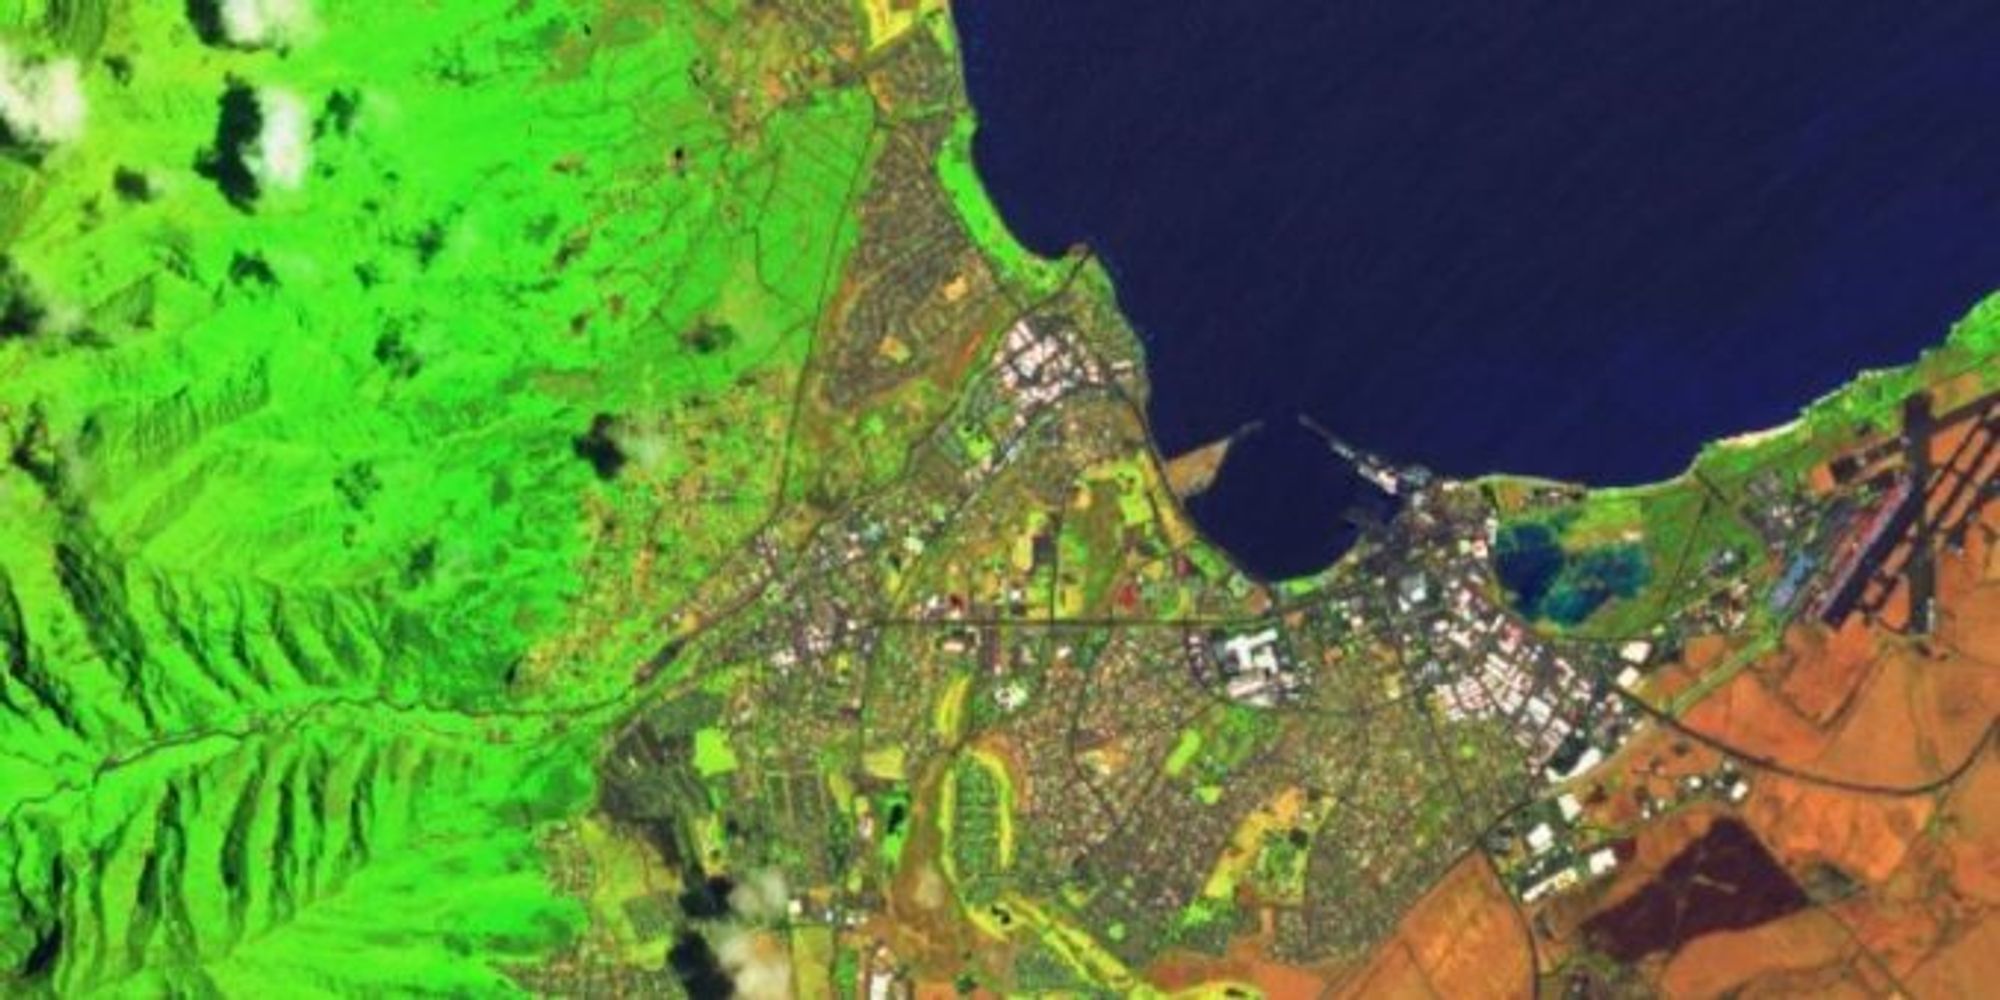
Short-Wave Infrared (B12, B8A, B4)
 The short-wave infrared band combination uses SWIR (B12), NIR (B8A), and red (B4). This composite shows vegetation in various shades of green. In general, darker shades of green indicate denser vegetation. But brown is indicative of bare soil and built-up areas.
Agriculture (B11, B8, B2)
 The agriculture band combination uses SWIR-1 (B11), near-infrared (B8), and blue (B2). It’s mostly used to monitor the health of crops because of how it uses short-wave and near-infrared. Both these bands are particularly good at highlighting dense vegetation that appears as dark green.
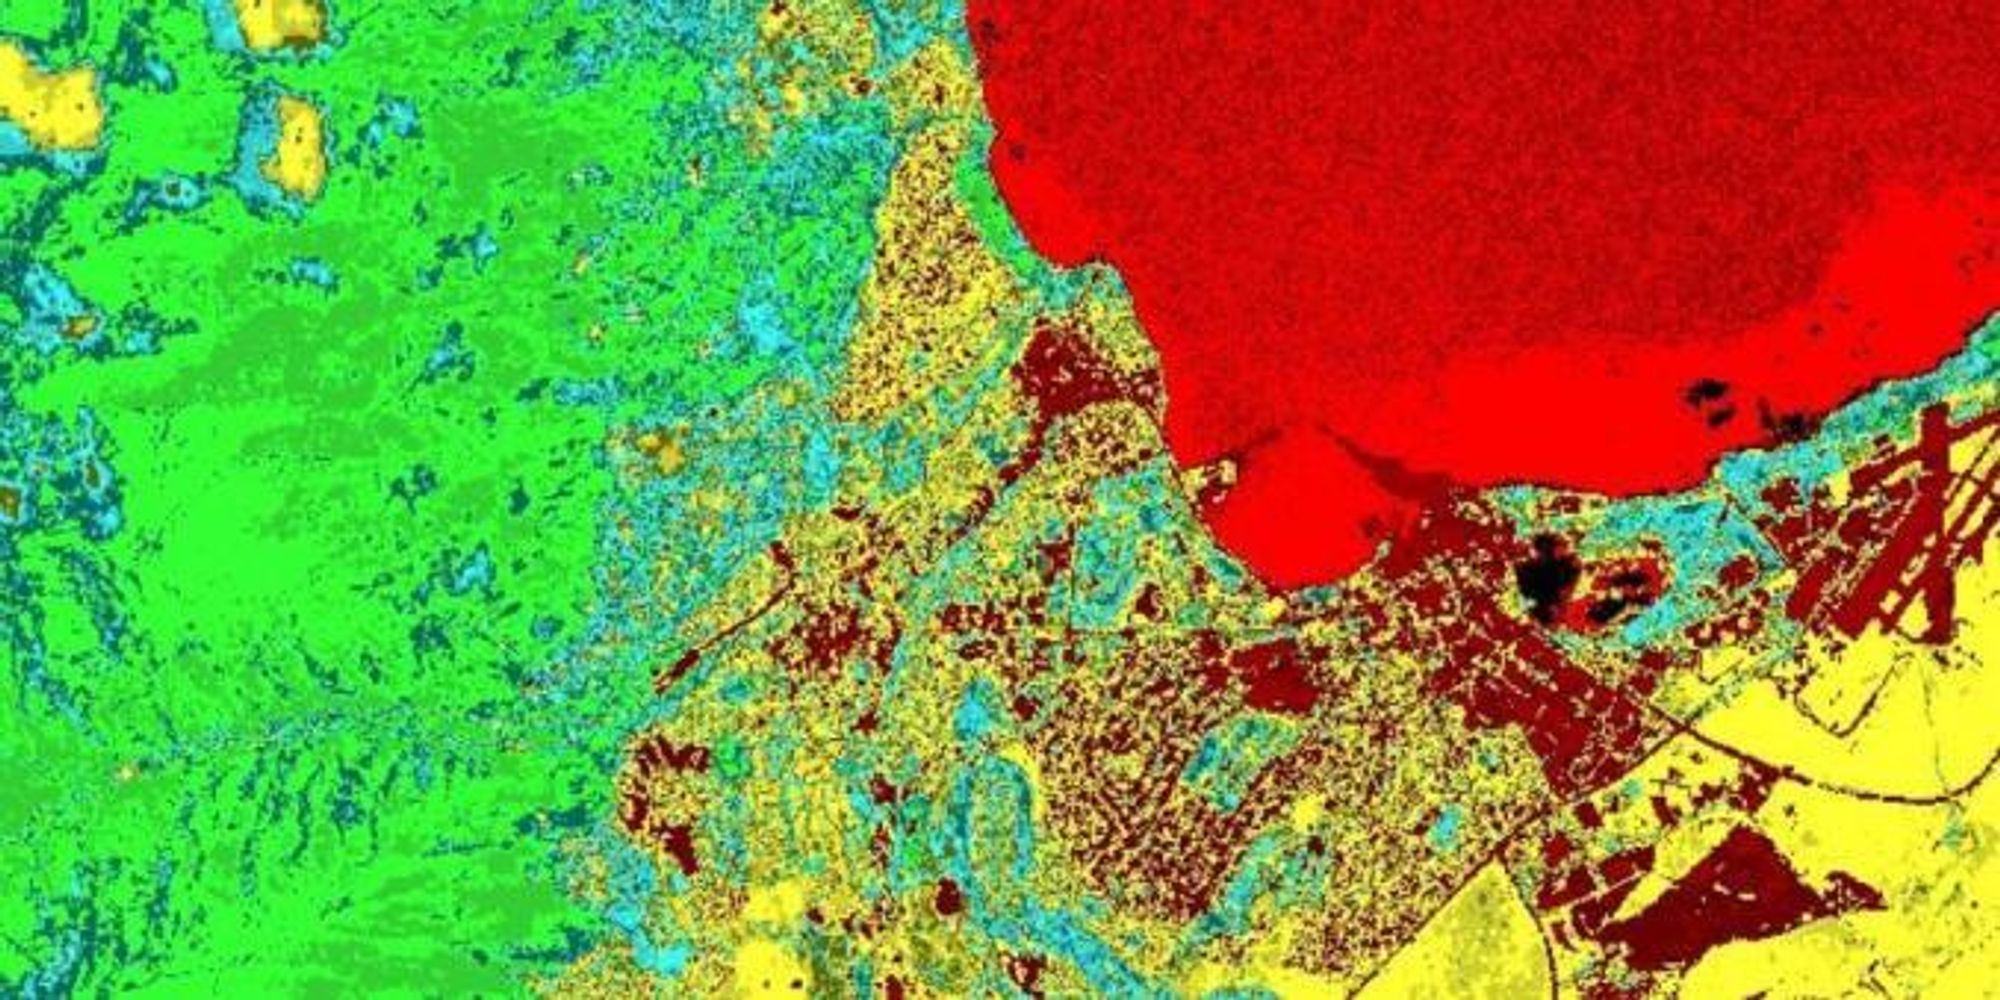
Geology (B12, B11, B2)
 The geology band combination is a neat application for finding geological features. This includes faults, lithology, and geological formations. By leveraging the SWIR-2 (B12), SWIR-1 (B11), and blue (B2) bands, geologists tend to use this Sentinel band combination for their analysis.
Bathymetric (B4, B3, B1)
 As the name implies, the bathymetric band combination is good for coastal studies. The bathymetric band combination uses the red (B4), green (B3), and coastal band (B1). Using the coastal aerosol band is good for estimating suspended sediment in the water.
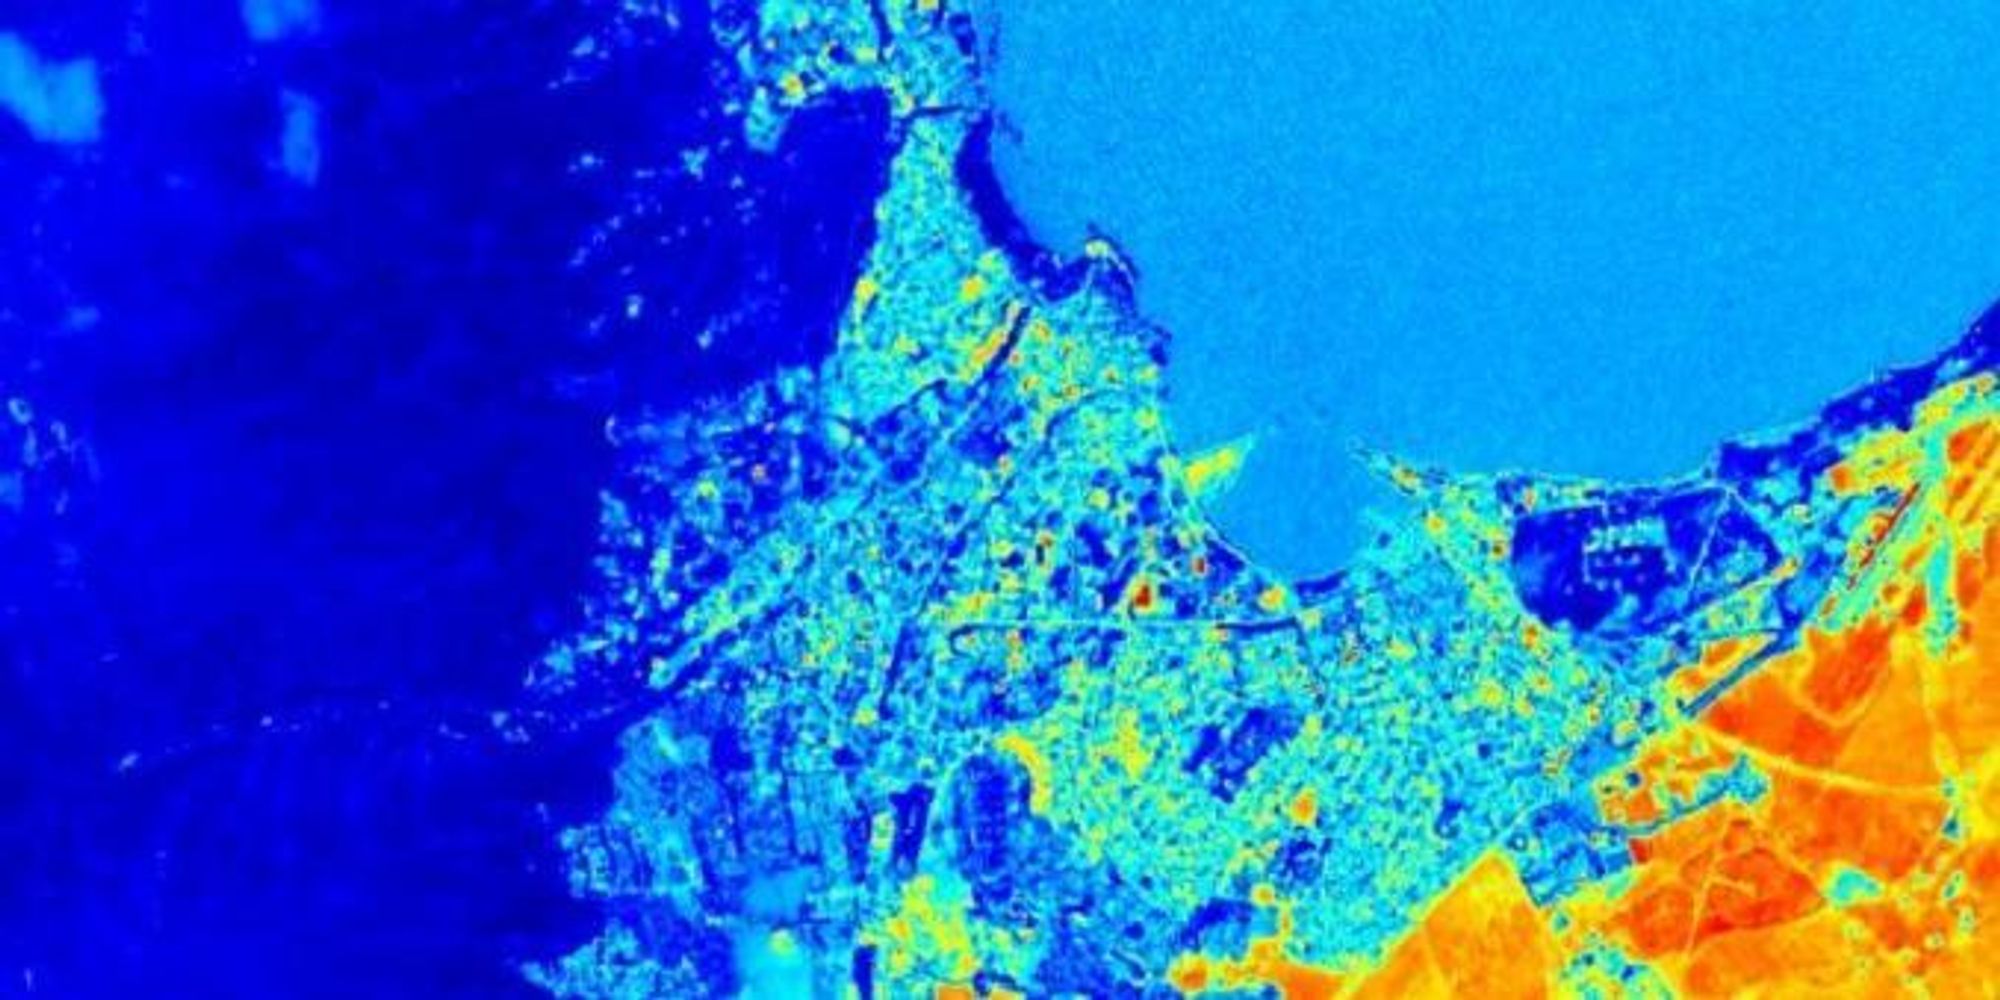
Vegetation Index (B8-B4)/(B8+B4)
 Because near-infrared (which vegetation strongly reflects) and red light (which vegetation absorbs), the vegetation index is good for quantifying the amount of vegetation. The formula for the normalized difference vegetation index is (B8-B4)/(B8+B4). While high values suggest dense canopy, low or negative values indicate urban and water features.
Moisture Index (B8A-B11)/(B8A+B11)
 The moisture index is ideal for finding water stress in plants. It uses the short-wave and near-infrared to generate an index of moisture content. In general, wetter vegetation has higher values. But lower moisture index values suggest plants are under stress from insufficient moisture.
Usage
- Level-1C Sentinel-2 data contain 13 UINT16 spectral bands representing TOA reflectance scaled by 10000. See the Sentinel-2-User-Handbook for details. In addition, three QA bands are present where one (QA60) is a bitmask band with cloud mask information. For more details, see the full explanation of how cloud masks are computed.